Toying with GCC JIT – Part 3
In the last two parts of this series we've seen how to use GCC JIT and how to apply it to a simple regular expression matcher. But an open question remains, has it been worth the effort? This part will try to figure it out.
Generated recognizer
If you want to see the generated code (out of curiosity or for debugging), you can dump it into a Graphviz file. For instance, for the regular expression ab*c we generate a match function that looks like this. Note: to understand these graphs just recall that (char)97 is a
, (char)98 is b
and (char)99 is c
.
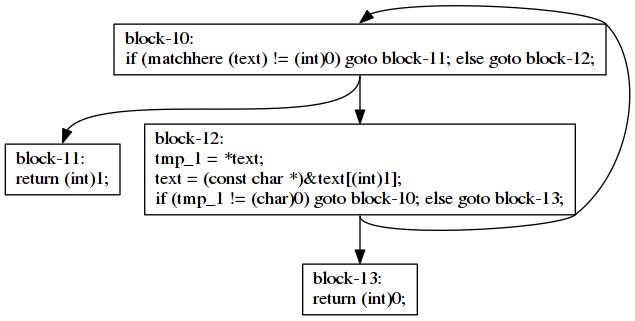
Function match, calls matchere in block-10. Its code looks like this.
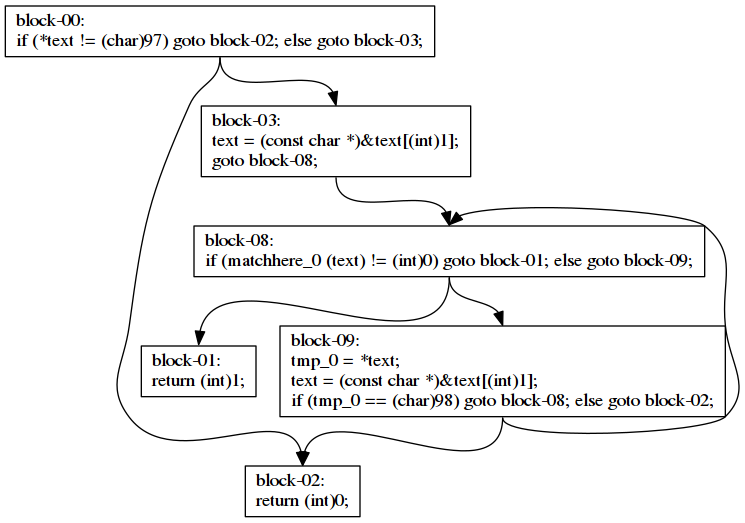
Function matchhere calls matchhere_0 in block-08. Its code looks like this.
Initial evaluation
Compilation is a hard process so the gains in speed when using a compiled regular expression matcher have to compensate the extra effort put in JIT compilation.
Let's first run the interpreted matcher to have a baseline. We will use the perf tool.
$ perf stat  -r 10 ./jgrep-basic Alice.*Rabbit pg11.txt
 ...
 Performance counter stats for './jgrep-basic Alice.*Rabbit pg11.txt' (10 runs):

          1.452121      task-clock (msec)         #    0.881 CPUs utilized
                 6      context-switches          #    0.004 M/sec
                 0      cpu-migrations            #    0.000 K/sec
               411      page-faults               #    0.274 M/sec
           5337176      cycles                    #    3.555 GHz
          10176018      instructions              #    1.84  insns per cycle
           2767256      branches                  # 1843.335 M/sec
             28643      branch-misses             #    1.03% of all branches

       0.001647421 seconds time elapsed                                          ( +-  1.97% )
$ perf stat -r 10 ./jgrep-basic Rabbit.*Alice pg11.txt
...
Performance counter stats for './jgrep-basic Rabbit.*Alice pg11.txt' (10 runs):
1.387412 task-clock (msec) # 0.880 CPUs utilized
6 context-switches # 0.004 M/sec
0 cpu-migrations # 0.000 K/sec
410 page-faults # 0.288 M/sec
5101269 cycles # 3.579 GHz
<not supported> stalled-cycles-frontend
<not supported> stalled-cycles-backend
9765089 instructions # 1.86 insns per cycle
2631812 branches # 1846.365 M/sec
27335 branch-misses # 1.04% of all branches
0.001576010 seconds time elapsed ( +- 1.44% )As you can see, the original matcher is really fast and takes almost no time to run. Let's see now the JIT matcher.
 Performance counter stats for './jgrep-jit Alice.*Rabbit pg11.txt' (10 runs):

         29.554189      task-clock (msec)         #    0.957 CPUs utilized
                76      context-switches          #    0.003 M/sec
                18      cpu-migrations            #    0.599 K/sec
              4760      page-faults               #    0.158 M/sec
         109495083      cycles                    #    3.642 GHz
         151094731      instructions              #    1.35  insns per cycle
          32323055      branches                  # 1075.125 M/sec
            907950      branch-misses             #    2.81% of all branches

       0.030883701 seconds time elapsed                                          ( +-  0.70% )
Performance counter stats for './jgrep-jit Rabbit.*Alice pg11.txt' (10 runs):
29.393373 task-clock (msec) # 0.949 CPUs utilized
38 context-switches # 0.001 M/sec
18 cpu-migrations # 0.594 K/sec
4755 page-faults # 0.157 M/sec
109429723 cycles # 3.612 GHz
150594506 instructions # 1.34 insns per cycle
32197029 branches # 1062.878 M/sec
910856 branch-misses # 2.83% of all branches
0.030959663 seconds time elapsed ( +- 0.48% )Hey! It's slower! More than 15 times slower! Well, the truth is that Alice in Wonderland is a small text file. If we repeat the test on a big text file of 38 MiB (obtained from this benchmarking regex libraries page) then the results are slightly different.
 Performance counter stats for './jgrep-basic Linus.*Linux howto' (10 runs):

        148.132887      task-clock (msec)         #    1.016 CPUs utilized
                65      context-switches          #    0.447 K/sec
                 1      cpu-migrations            #    0.007 K/sec
               410      page-faults               #    0.003 M/sec
         554034387      cycles                    #    3.814 GHz
        1534869684      instructions              #    2.81  insns per cycle
         460535913      branches                  # 3170.543 M/sec
           4086146      branch-misses             #    0.89% of all branches

       0.145729496 seconds time elapsed                                          ( +-  0.47% )
Performance counter stats for './jgrep-jit Linus.*Linux howto' (10 runs):
91.948973 task-clock (msec) # 0.982 CPUs utilized
70 context-switches # 0.756 K/sec
18 cpu-migrations # 0.194 K/sec
4754 page-faults # 0.051 M/sec
340684126 cycles # 3.677 GHz
626983375 instructions # 1.81 insns per cycle
169981734 branches # 1834.622 M/sec
4720583 branch-misses # 2.78% of all branches
0.093643667 seconds time elapsed ( +- 0.47% )Now the results show that our JIT is about 1.55 times faster. Not really brilliant but on big files that extra speed is always very well welcome.
Out of the critical path
The problem with the existing approach is that the JIT compilation may or may not bring enough benefits to be worth. What if we could have the cake and eat it? The idea is to JIT compile the matcher and if we have not finished yet matching lines, switch from the interpreted matcher to the compiled one. If there was not enough time, well, the compilation is simply discarded.
For the sake of simplicity, we will pass the same arguments as the interpreted code (regexp and text) to the JIT code although, as we know, the regexp parameter will not be used. Also, to avoid complicating the code too much, there will be two global variables match_fun and regexp that will be initialized at the beginning of the main function. These two variables will keep the current matcher function being used and the regular expression. For the matcher function variable, we will initialize it with the interpreted matcher.
int main(int argc, char *argv[])
{
  if (argc != 3)
  {
    fprintf(stderr, "usage: %s regex filename\n", argv[0]);
    exit(EXIT_FAILURE);
  }

  regexp = strdup(argv[1]);
  match_fun = match;
Then we will proceed to match lines. Since the matcher function may eventually change to the compiled version, we will load it at each iteration, before calling it.
  while (getline(&line, &length, f) != -1)
  {
      match_fun_t pmatch_fun = atomic_load(&match_fun);
      int m = pmatch_fun(regexp, line);
      if (m)
          fprintf(stdout, "%s", line);
  }
We need to make an atomic_load to avoid data races because this variable will be written, concurrently, when the JIT compilation finishes.
To concurrently compile the code, well, we will just spawn a detached pthread before starting matching lines.
  pthread_t concurrent_jit;
  int res = pthread_create(&concurrent_jit, NULL, concurrent_jit_run, NULL);
  if (res != 0)
  {
      fprintf(stderr, "cannot create pthread: %s\n", strerror(errno));
  }
  pthread_detach(concurrent_jit);
A detached pthread will allow us to end the program even if the JIT compilation has not finished yet. This way we will be able to benefit from the fastest execution technique assuming that we can run two threads in parallel. Almost all processors in current computers can.
The function concurrent_jit, simply compiles the code and updates the match_fun pointer.
static void* concurrent_jit_run(void *info /* unused */)
{
    gcc_jit_context *ctx;
    ctx = gcc_jit_context_acquire ();
    if (ctx == NULL)
    {
        fprintf(stderr, "acquired JIT context is NULL");
        return NULL;
    }

    gcc_jit_context_set_int_option(ctx, GCC_JIT_INT_OPTION_OPTIMIZATION_LEVEL, 2);

    generate_code_regexp(ctx, regexp);

    gcc_jit_result *result = gcc_jit_context_compile(ctx);
    if (result == NULL)
    {
        fprintf(stderr, "compilation failed");
        return NULL;
    }

    match_fun_t function_addr = (match_fun_t)gcc_jit_result_get_code(result, "match");
    if (function_addr == NULL)
    {
        fprintf(stderr, "error getting 'match'");
        return NULL;
    }

    atomic_store(&match_fun, function_addr);

    return NULL;
}
In this case we have to use an atomic_store to correctly update the value of match_fun without incurring in data-races.
Evaluation
Let's see if compiling concurrently improves for the short case (where compiling is not worth).
 Performance counter stats for './jgrep-concurrent Alice.*Rabbit pg11.txt' (10 runs):

          2.332571      task-clock (msec)         #    1.273 CPUs utilized
                 8      context-switches          #    0.003 M/sec
                 1      cpu-migrations            #    0.419 K/sec
               664      page-faults               #    0.278 M/sec
           8572396      cycles                    #    3.593 GHz
          13861606      instructions              #    1.58  insns per cycle
           3562561      branches                  # 1493.029 M/sec
             42731      branch-misses             #    1.21% of all branches

       0.001832130 seconds time elapsed                                          ( +-  1.06% )
Now the timings are much better. The performance is just about 1.15 times worse than the original algorithm. Compared to the 15 times slowdown of the first approach this is quite an improvement. Let's see what happens with the big file.
 Performance counter stats for './jgrep-concurrent Linus.*Linux howto' (10 runs):

        109.696936      task-clock (msec)         #    1.324 CPUs utilized
                67      context-switches          #    0.608 K/sec
                21      cpu-migrations            #    0.191 K/sec
              4660      page-faults               #    0.042 M/sec
         406626883      cycles                    #    3.690 GHz
         821148178      instructions              #    2.02  insns per cycle
         230758607      branches                  # 2094.166 M/sec
           4748270      branch-misses             #    2.06% of all branches

       0.082870971 seconds time elapsed                                          ( +-  0.68% )
Great. We do not lose performance, we even improve a bit, about 1.15 times better. Not much improvement but shows that we actually want to take the compilation out of the critical path.
Viewing the concurrent compilation
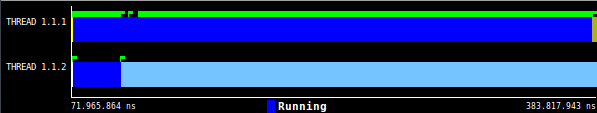
Using the Extrae library we can instrument a pthreads program to get a trace that can be visualized using Paraver. Here we see what happens in the case of Alice.*Rabbit.
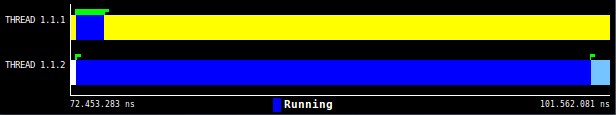
Thread 1.1.1 is the main thread (the one running the main function) and thread 1.1.2 is the one that compiles our code. As you can see, JIT compilation takes much longer than actually matching the lines. The blue part in the main thread is where all the calls to match happen. Every call to match is rendered as a green flag but they are drawn overlapped because they last so short.
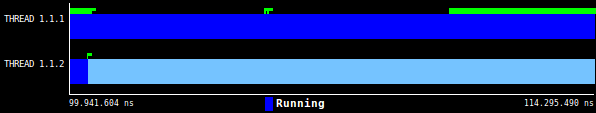
For the long file doing Linus.*Linux, the result is quite the opposite. The overall matching process lasts much more than JIT compilation.
When the code has just been compiled, we see that the a couple of matching calls becomes much slower. The reason is probably caused by the communication between the two threads using atomic instructions.
Within Paraver we can also measure the average duration of the calls to match.
| Kind of code | Average (nanoseconds) |
|---|---|
| Interpreted | 197.29 |
| Compiled | 126.88 |
This is consistent with the speed gain of 1.55 times we observed with jgrep-jit on the big file.
Wrap-up
In these three-part short series about GCC JIT we have seen how to apply it to a regular expression matcher to get a bit more of speedup. The obtained speed gains are moderate (1.55 times). Since compilation may be a slow process, taking the compilation out of the critical path is beneficial for the cases where it may undermine the overall execution time of the program.
I have uploaded the code used in this series to github.
That's all for today.